Cutting Churn Before the Ticket Arrives (SaaS)
How Loomstack Inc. consolidated its customer-success stack into a single Airtable workspace, surfacing at-risk accounts 47 days earlier and lifting net revenue retention from 102% to 114%.
 Airtable
- Airtable
- HubSpot
- Stripe
- Google Sheets
- Slack
- Notion
- Zapier
- Gmail
- Typeform
- Client: Loomstack Inc.
- Industry: B2B SaaS, workflow automation
- Segment: Series B, Enterprise + Mid-Market
- Company size: 180 employees, 14 CSMs
- Project duration: 9 weeks (discovery → go-live)
- Deliverables: 11 tables, 9 automations, 3 interfaces
Executive Summary
A purpose-built customer-success workspace
Loomstack Inc. is a Series B B2B SaaS company providing workflow automation tooling to mid-market and enterprise customers, with roughly $24M ARR across 280 paying accounts. By Q4 2025 the customer success team was operating across five disconnected tools: HubSpot for CRM data, Zendesk for support tickets, Stripe for subscriptions, a homegrown product-usage dashboard, and a sprawl of Google Sheets for everything that didn’t fit elsewhere. Health scoring was a quarterly spreadsheet exercise, and renewal forecasts were assembled by hand the week before each board meeting.
Over a 9-week engagement we replaced this stack’s coordination layer with a single Airtable workspace, a unified accounts table, computed health scores updated nightly, role-specific Interfaces for CSMs and the VP, and an automation suite that triggers playbooks before churn risk turns into a churn ticket. HubSpot, Zendesk and Stripe still own their primary data; Airtable is the operating surface on top.
Outcomes after 90 days in production
At a glance
Before: 5 disconnected tools, quarterly health scoring done in a spreadsheet, renewal forecast assembled by hand, average risk detection lag of 51 days.
After: 1 Airtable workspace as the CS operating layer, health scores recomputed nightly, live forecast on the VP dashboard, average risk detection lag of 4 days.
Background
The client and the problem
About Loomstack
Loomstack sells a workflow automation platform to mid-market and enterprise operations teams across North America and EMEA. Headcount is 180; the customer-facing org is split into 14 CSMs (segmented by Enterprise / Mid-Market), 6 support engineers, and 4 account executives covering expansion. The CS leadership reports to a VP of Customer Success who in turn reports to the COO.
The pain points that triggered the project
- Churn was being detected too late. The first signal an account was in trouble was usually a renewal coming up in 30 days and a CSM scrambling. Two enterprise logos worth $640K combined churned in Q3 2025 with effectively no warning.
- Health scoring was theatre. A quarterly spreadsheet exercise produced colour-coded statuses that nobody trusted, by the time it shipped, the underlying data was already 4–6 weeks stale.
- CSMs lived in eight tabs. A typical customer review meant opening HubSpot, Zendesk, Stripe, Mixpanel, the usage dashboard, the renewal sheet, the QBR notes doc, and the Slack channel, for every account.
- Forecasts were unreliable. The VP’s renewal forecast was built in a spreadsheet from CSM-submitted estimates; variance against actuals was running ±22% per quarter.
- Playbooks didn’t run. The CS playbook library lived in Notion but was almost never triggered, because nothing automatically noticed when a playbook should fire.
Why Airtable
Loomstack evaluated three category-leading customer success platforms and Airtable. The decision came down to four factors: (1) Loomstack already had clean data sitting in HubSpot, Zendesk and Stripe, what they needed wasn’t another database, but a coordination layer on top, (2) the CS ops team wanted to own the system and iterate on it weekly without a vendor implementation queue, (3) the health-score formula needed to be theirs, not a vendor’s black box, and (4) integration with Slack was non-negotiable. Airtable’s linked-record model, sync sources, and native Slack actions made it the right fit.
Approach
How the implementation was run
We delivered the implementation in four phases over nine weeks. A core working group made up of the VP of Customer Success, two senior CSMs (one per segment), the head of CS Ops, and a RevOps analyst met twice a week to validate the data model, review prototypes, and approve each automation before it went live.
| Phase | Weeks | What we did | Output |
|---|---|---|---|
| 1. Discovery | 1–2 | Shadowed CSMs through 5 customer reviews. Audited HubSpot, Zendesk, Stripe and the usage dashboard. Workshopped the health-score formula with leadership. | Process map, data dictionary, agreed health-score definition. |
| 2. Data model & sync | 3–4 | Designed 11-table relational schema. Configured one-way syncs from HubSpot (accounts/contacts), Stripe (subscriptions) and Zendesk (tickets). | Live Airtable base with synced data; ER diagram. |
| 3. Interfaces & automations | 5–7 | Built the CSM Command Center, the Account Detail Workspace and the VP Forecast Room. Designed and tested 9 automations. | 3 production interfaces; automation library. |
| 4. Pilot, training, go-live | 8–9 | Piloted with 4 CSMs for one week, trained all 14 CSMs and the VP team, ran a 3-day shadow-mode period before full cutover. | Single-day cutover; 14 / 14 CSMs active on day 1. |
Guiding principles
- Don’t replace systems of record. HubSpot, Zendesk and Stripe stay as systems of record. Airtable is the system of action on top: pulling from each, surfacing what matters, and writing back where appropriate.
- One health score, one definition. Health is a single formula owned by CS leadership, not three competing scores. Every place it appears in the workspace is the same calculation.
- Surface signals, don’t bury them. An at-risk account should be impossible to miss. Risk surfaces on the CSM dashboard, the VP forecast, and as a Slack alert, within 24 hours of the signal.
- CS Ops owns the base. The head of CS Ops and a RevOps analyst were trained as base administrators and now ship changes weekly without engineering or vendor involvement.
What Was Built
The Accounts table: the heart of the workspace
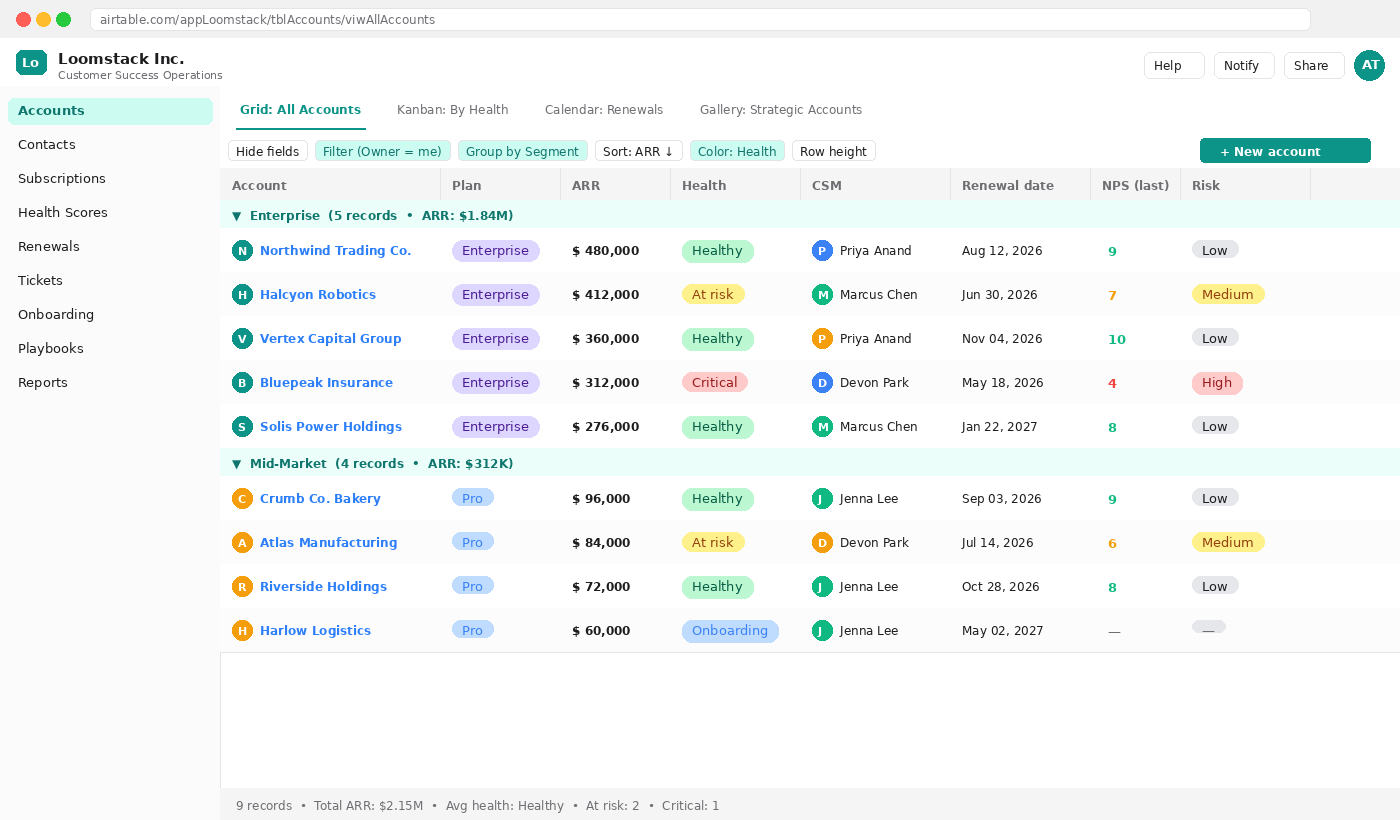
Every paying customer is a record in the Accounts table. From here, CSMs can see their book of business at a glance, sliced by segment, plan, health band, or renewal window. The grid below shows the production view used by the VP each Monday to triage the team’s at-risk accounts.
Highlights of this view
- Health is a coloured chip driven by a formula on the record. It’s the same calculation everywhere it’s shown.
- ARR is a rollup from the linked Subscriptions table, which is one-way synced from Stripe, no double-entry, no drift.
- CSM is a linked record to the Staff table, so rebalancing books happens in one place and propagates everywhere.
- NPS (last) is a lookup from the most recent record in the NPS Responses table, refreshed automatically.
Two more views the team uses every day
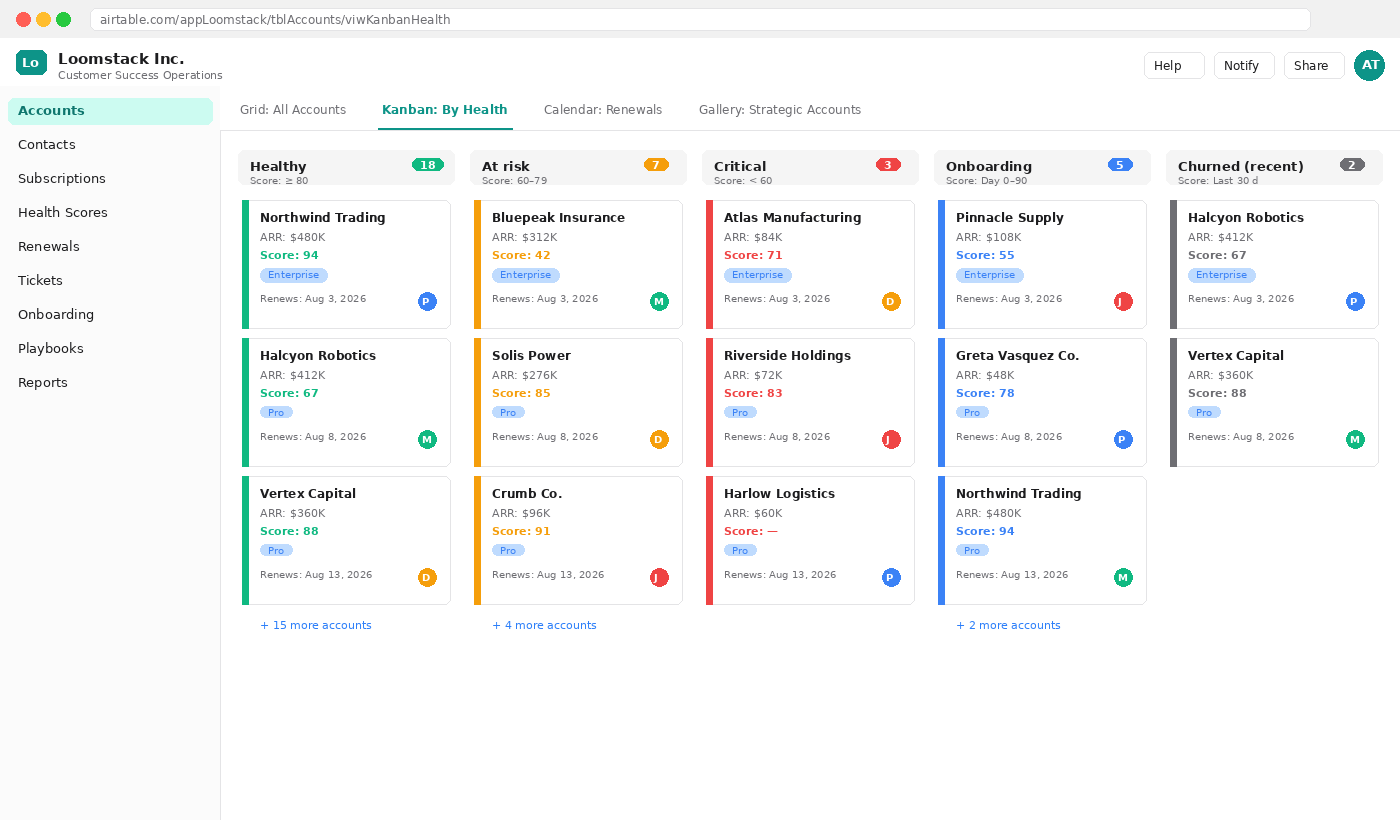
Kanban by health band is the view the VP uses on Monday morning. Cards are stack-ordered by ARR, so the largest at-risk accounts always sit at the top. The colour bar on the left of each card encodes the band; the avatar in the corner is the CSM.
The expanded account record
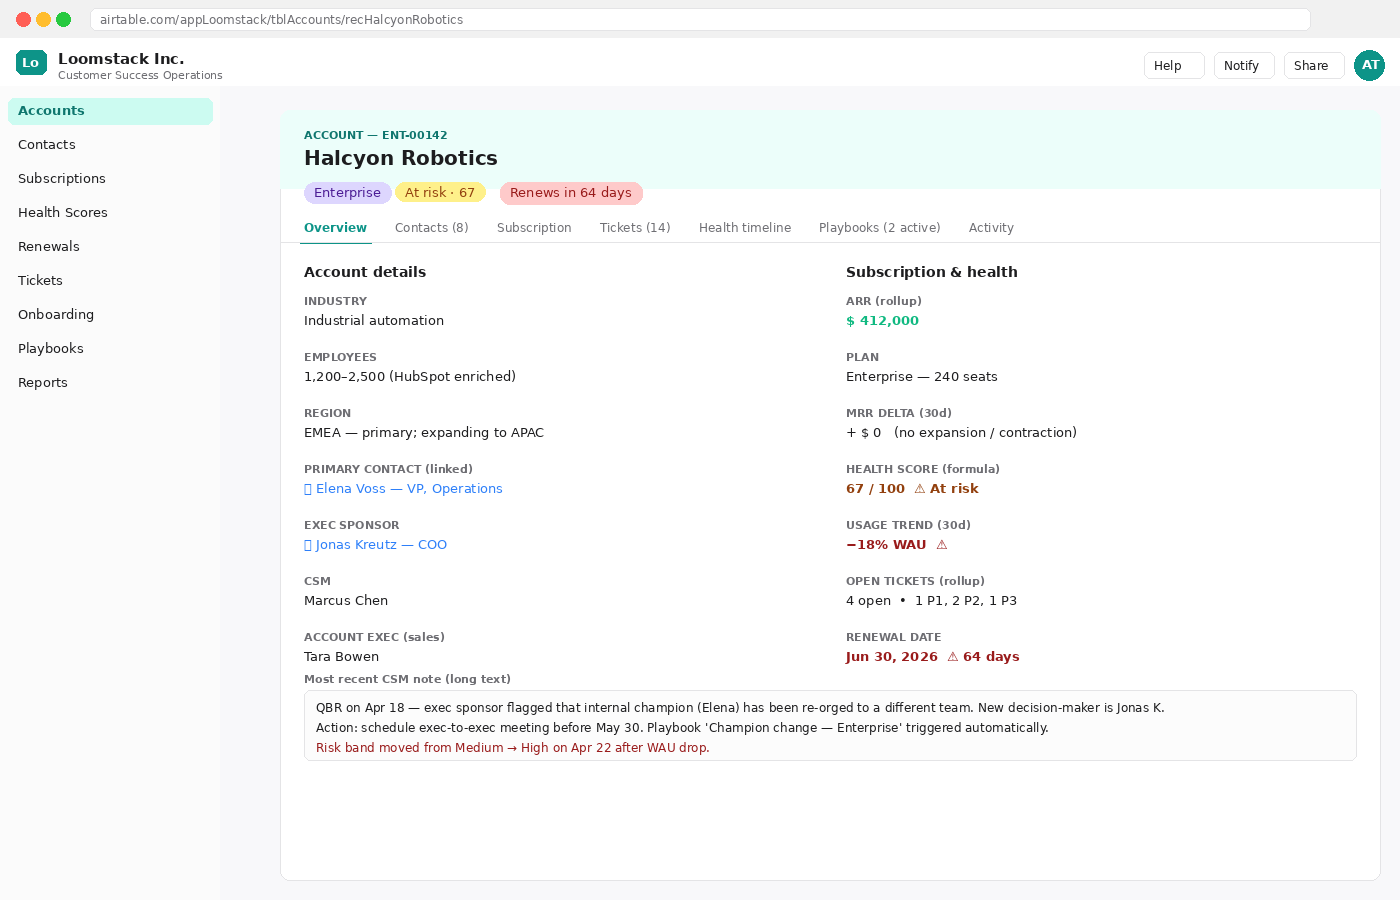
Clicking any row opens the full account detail. This is the screen a CSM lives in during a customer review, every field a CSM might want is on one page, computed live from the underlying tables. The Health Score, Usage Trend, Open Tickets and Days to Renewal all turn red automatically when they cross their respective thresholds.
The Data Model
Eleven tables, one source of truth
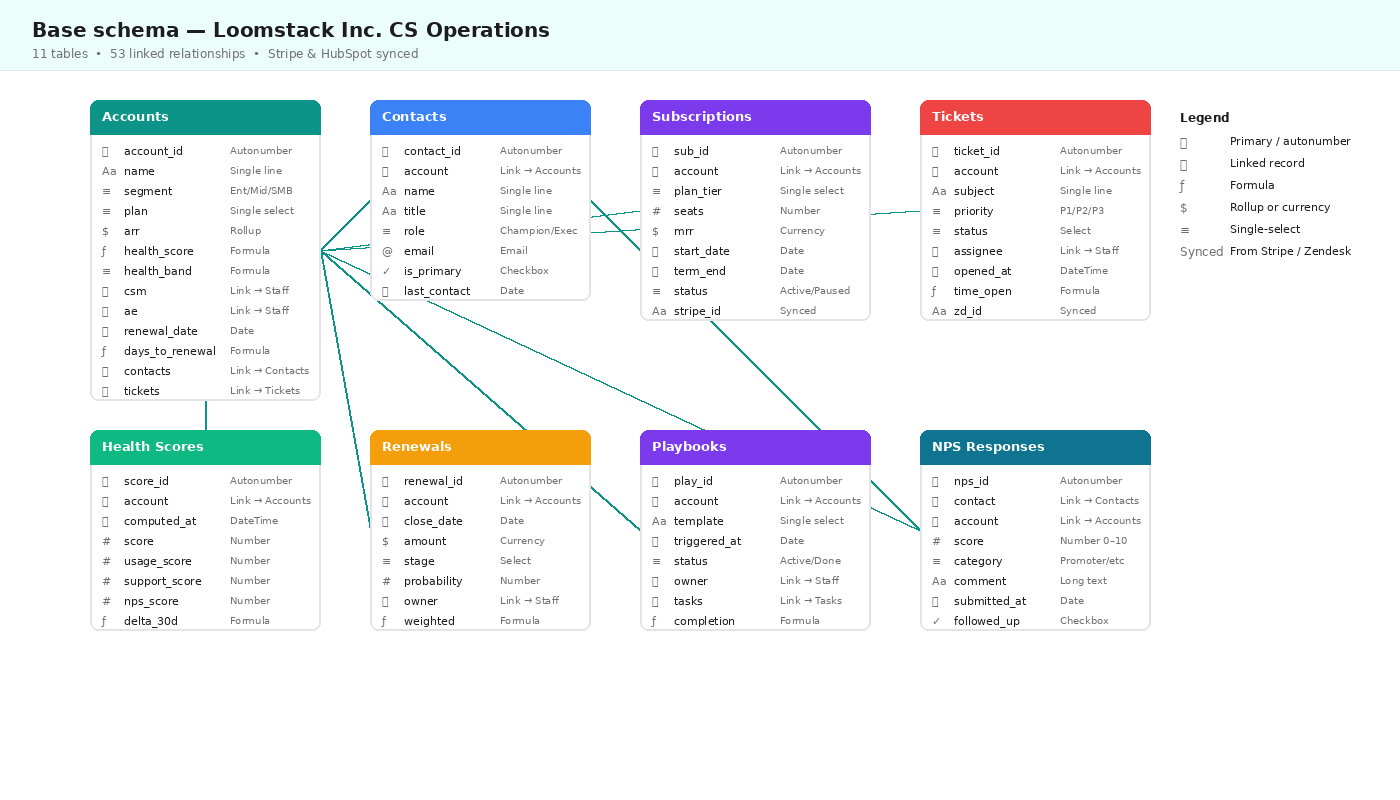
The base is built around Accounts as the central entity. Everything else (contacts, subscriptions, tickets, health scores, renewals, playbooks, NPS responses) links back to an account. This single design decision is what makes the rollups, formulas and automations possible.
Field-level decisions worth calling out
- health_score is a single formula combining four sub-scores: usage (40%), support (25%), NPS (20%), commercial signals (15%). Weights live in a Settings table so leadership can tune them without code changes.
- health_band is a derived formula (Healthy / At risk / Critical) with bands at 80 and 60, the only place the thresholds are defined in the entire workspace.
- days_to_renewal is a formula reading from renewal_date; the renewal automations all read this field, so date arithmetic lives in one place.
- Subscriptions is one-way synced from Stripe: Airtable doesn’t write back. ARR is rolled up from synced rows.
- Tickets is one-way synced from Zendesk every 15 minutes, open_tickets on the Account is a count rollup.
Interfaces
Three role-based interfaces, one underlying base
Different people on the CS org need different things from the same data. We built three Interfaces on top of the base, each tailored to a role. All three read from and write to the same tables. There is no duplication.
The CSM Command Center
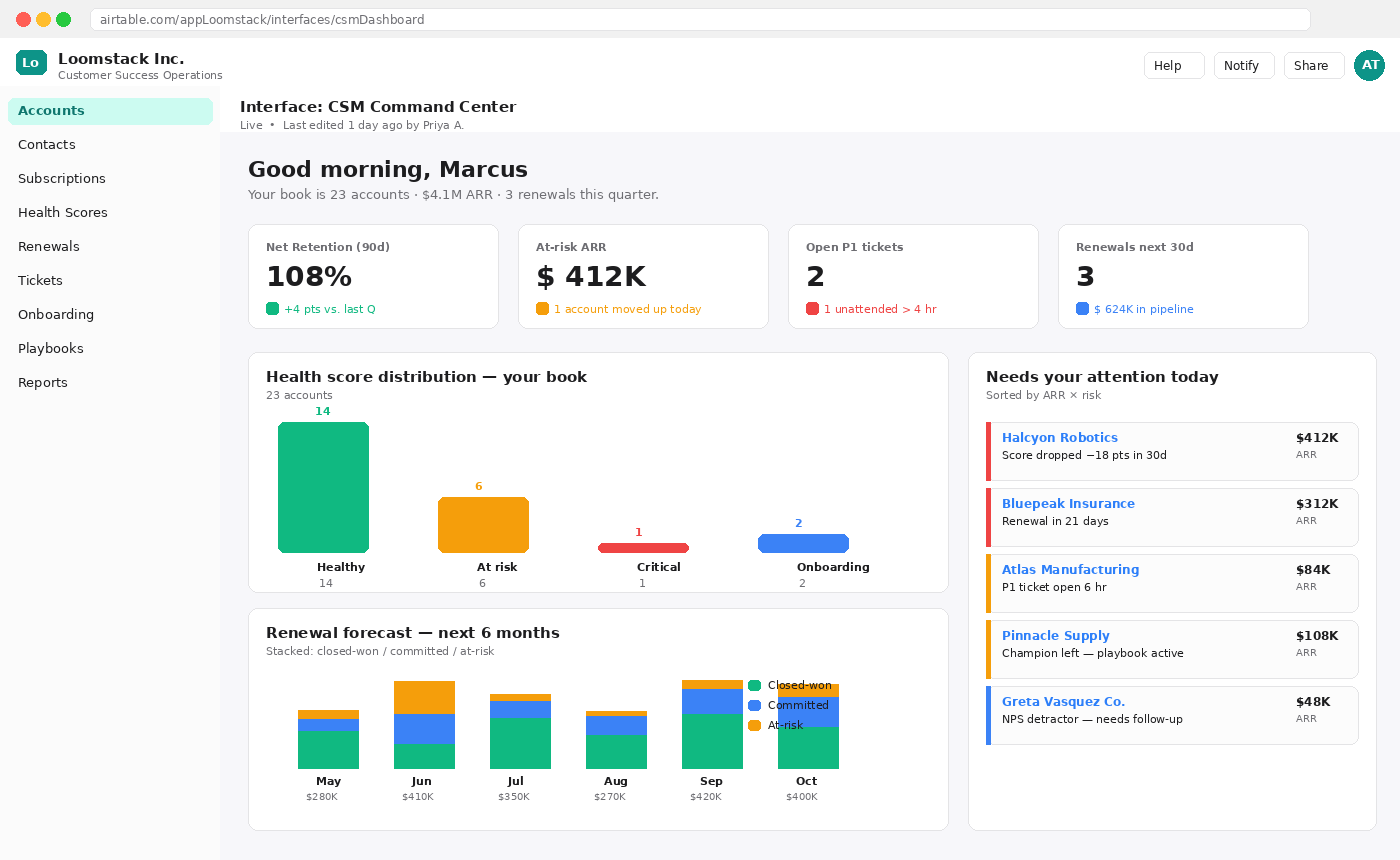
This is the screen a CSM opens when they sit down at their desk. It surfaces the four KPIs that matter to them, the live health distribution of their book, a renewal forecast for the next six months, and a prioritised list of accounts that need attention today, all filtered to their book automatically.
Two other interfaces
- Account Detail Workspace: the single screen a CSM uses during a customer review. Live health timeline, ticket history, usage chart, contacts directory, active playbooks, and a notes stream, all on one scrollable page.
- VP Forecast Room: read-only org-wide view for CS leadership. Net revenue retention trend, weighted renewal forecast by quarter, churn-risk dollar amount, and CSM utilisation. Replaces what used to be a manual Friday afternoon spreadsheet exercise.
Automations
Automating the work that catches churn early
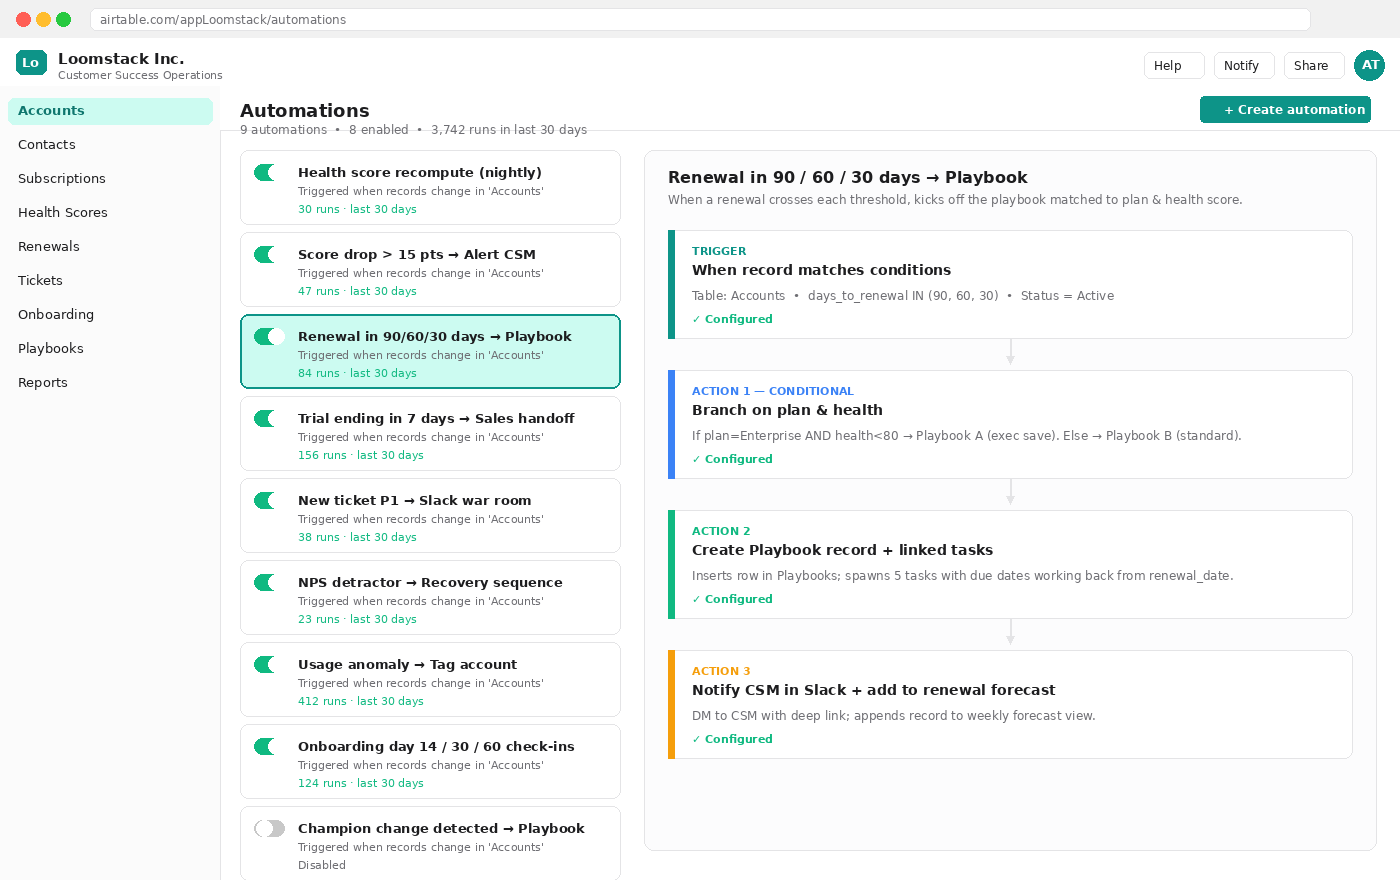
Nine automations remove roughly 3,700 manual touchpoints from the team’s month, but more importantly, they catch churn signals while there’s still time to act. None of them replace a CSM’s judgment; they make sure no signal slips through.
The automation catalogue
Each automation is owned by a named person on the CS Ops team, documented in a Notion runbook, and reviewed monthly.
| # | Automation | Trigger | Actions | Replaces |
|---|---|---|---|---|
| 1 | Health score recompute (nightly) | Schedule: 2:00 AM, every night | Runs the health-score formula across all accounts; writes a row into Health Scores; updates health_band. | Quarterly spreadsheet exercise |
| 2 | Score drop > 15 pts → Alert CSM | Health Scores.delta_30d < −15 | Slack DM to CSM + tags account as ‘momentum loss’; logs into the activity timeline. | Nothing: drops were missed |
| 3 | Renewal in 90/60/30 days → Playbook | Accounts.days_to_renewal IN (90, 60, 30) | Branches on plan + health to pick playbook (e.g. Enterprise + <80 → exec save). Spawns 5 linked tasks. | Manual playbook lookup in Notion |
| 4 | Trial ending in 7 days → Sales handoff | Subscriptions.status = trial AND term_end in 7 days | Creates handoff record; assigns AE; Slack DM to AE with usage summary; books a calendar slot. | CSM-to-AE handoff via email |
| 5 | New ticket P1 → Slack war room | Tickets.priority = P1 (synced from Zendesk) | Posts to #cs-warroom; tags CSM, AE, support engineer; creates a Linear issue if flagged. | Manual Slack post by support |
| 6 | NPS detractor → Recovery sequence | NPS Responses.score ≤ 6 | Sets account flag; emails CSM with NPS comment; creates a follow-up task due in 48 hours. | NPS responses going unread |
| 7 | Usage anomaly → Tag account | Usage signal: WAU drop > 25% w/w | Sets a ‘usage_drop’ tag; surfaces it on CSM dashboard ‘Needs attention’ panel. | Caught (sometimes) at quarter-end |
| 8 | Onboarding day 14/30/60 check-ins | Schedule: nightly scan of accounts in Onboarding | Spawns the right check-in task at each milestone; emails customer with the day-30 product-tour link. | Three different CSM templates |
| 9 | Champion change detected → Playbook | Contacts.is_primary changes OR HubSpot role-change signal | Creates ‘Champion change’ playbook record; spawns a 5-step exec-meeting save plan. | Nothing: usually noticed too late |
Worked example: automation #3 in detail
- Trigger: nightly check on every Account where days_to_renewal equals exactly 90, 60, or 30 and status = Active.
- Action 1 (Conditional branch): evaluates plan + health. Enterprise + health < 80 routes to Playbook A: Executive Save; everything else routes to Playbook B: Standard Renewal.
- Action 2 (Create Playbook + tasks): writes a row in the Playbooks table linked to the account, then spawns 5 tasks with due dates working back from the renewal date.
- Action 3 (Notify): Slack DM to the CSM with a deep link to the account; appends the record to the VP’s weekly forecast view.
- Replaced: CSMs manually checking renewal calendars and looking up playbooks in Notion (frequently the wrong playbook, frequently too late).
Integrations
How the workspace connects to the SaaS stack
Airtable doesn’t replace HubSpot, Zendesk, Stripe, or the product analytics warehouse. It coordinates them.
| System | Direction | What flows | Mechanism |
|---|---|---|---|
| HubSpot | One-way (in) | Accounts and Contacts sync nightly. Field-level mapping for industry, employee count, lifecycle stage and owner. | Airtable HubSpot sync source |
| Stripe | One-way (in) | Subscription rows sync every 4 hours. ARR rolls up from subscription records to the account. | Stripe → Airtable via Zapier |
| Zendesk | One-way (in) | Tickets sync every 15 minutes. Priority, status, assignee, and time-open are all rollup-able. | Native Zendesk sync |
| Slack | One-way (out) | Health drops, P1 tickets, renewal-playbook triggers, NPS detractor alerts. | Native Slack action in Automations |
| Mixpanel / Snowflake | One-way (in) | Daily WAU and feature-adoption metrics per account, used as inputs to the health score. | Snowflake → Airtable via reverse-ETL |
| Linear | One-way (out) | P1 tickets that need engineering escalation create a Linear issue with customer context attached. | Linear API call from script action |
| Gmail / Outlook | One-way (out) | Customer-facing emails (NPS follow-ups, day-30 onboarding tour) sent from automation actions. | Native email actions |
Permissions & data handling
- Workspace plan: Airtable Business with SAML SSO via the company’s identity provider. Two-factor authentication enforced for all users.
- Field-level permissions: ARR and renewal amounts are read-only for CSMs and hidden from support engineers; visible to AEs and the VP.
- Book-level filtering: CSMs see only their own accounts by default on every interface; the VP sees the full org. No CSM can edit another CSM’s accounts.
- Audit: Airtable’s revision history is retained, and a nightly backup is exported to the company’s S3 bucket via the Airtable API.
Results
Measurable change after 90 days in production
| Metric | Before | After | Change |
|---|---|---|---|
| Net revenue retention (NRR) | 102% | 114% | +12 pts |
| Average risk-detection lag | 51 days | 4 days | −92% |
| Renewal forecast variance | ± 22% | ± 6% | −73% |
| At-risk ARR identified earlier | n/a | $1.2M (Q1) | + saved revenue |
| CSM time spent on reporting | ≈ 6 hr / week | ≈ 45 min / week | −87% |
| Playbook trigger rate | ≈ 14% of cases | 100% of cases | + coverage |
| Automated touchpoints / month | 0 | 3,742 across 8 active flows | n/a |
| CSM adoption (firm-wide) | n/a | 14 / 14 active on day 1 | 100% |
In the words of the team
The thing that changed isn’t really the dashboard: it’s that the team has time. My CSMs aren’t building reports any more, they’re actually talking to customers. And when an account starts going sideways, we know about it the next morning, not three weeks later when the renewal blows up. We saved $1.2M of ARR last quarter that would otherwise have walked out the door.
VP of Customer Success, Loomstack Inc.
What we’d do again, and what we’d change
- Worked well: co-designing the health-score formula with leadership in week 1. Because they owned it from day one, nobody argued with the scores once they started shipping.
- Worked well: shipping the CSM Command Center first and the VP Forecast Room last. Adoption follows the front line.
- Would change: we underestimated the data-cleanup burden in HubSpot during phase 2. About 11% of accounts had missing or stale ownership; cleaning that up consumed three days we hadn’t planned for.
- Would change: add an in-product feedback widget that writes directly to the NPS Responses table. The current Typeform-based flow has a higher drop-off than we’d like.