Enterprise Ticketing & Revenue Data Pipeline
Turning daily ticketing PDFs and emails from multiple vendors into one automated revenue dashboard for a music festival organizer.
 Python Automation
- Python
- BigQuery
- Google Sheets
- Gmail
Overview
Palm Tree Crew, a live music festival organizer, needed accurate daily revenue and attendance numbers across several cities. We built a custom Python pipeline on Google Cloud that reads vendor audit emails, applies the client’s business rules, stores everything in BigQuery and renders an executive dashboard in Google Sheets with no manual steps.
The business problem
Every day the operations team downloaded static PDF audits from Ticketmaster, Front Gate Tickets and Posh. They split passes by hand (a 2-Day Pass counts toward both Friday and Saturday) and typed the numbers into a master Google Sheet. The work took hours and invited mistakes. VIP Table and Corporate Sponsorship revenue lived in separate spreadsheets, so leadership never saw total gross and remaining capacity in one place.
The solution
A cloud-hosted ETL pipeline runs on a schedule. It intercepts vendor emails through the Gmail API, parses PDF and HTML reports with custom Python code, calculates the client’s metrics, loads the results into Google BigQuery and rebuilds a styled Google Sheets dashboard. Offline revenue from other spreadsheets is linked in through a manual configuration area.
Project snapshot
| Item | Detail |
|---|---|
| Client | Palm Tree Crew |
| Industry | Live events and entertainment (music festivals) |
| Language | Python, written as custom code |
| Cloud | Google Cloud Run and Cloud Scheduler |
| Data warehouse | Google BigQuery |
| Integrations | Gmail API, Google Sheets API |
| Ticketing sources | Ticketmaster (PDF), Front Gate Tickets (HTML email), Posh |
How the System Works
The pipeline runs once per reporting cycle with no human steps, from vendor email to finished dashboard.
| Step | Process |
|---|---|
| 1. Scheduled start | Google Cloud Scheduler triggers the Python service on Cloud Run. |
| 2. Email ingestion | The Gmail API, with secure OAuth, picks up the daily audit emails from each ticketing vendor. |
| 3. Parsing | Vendor-specific parsers read the data: a PDF scraper for Ticketmaster, an HTML table parser for Front Gate Tickets. |
| 4. Business logic | Code applies the client’s rules: the 2-Day Rule, wrap rates and capacity detection. |
| 5. Warehouse load | Results are written to BigQuery in three tables, so every ticket sold keeps an audit trail. |
| 6. Dashboard render | The Google Sheets API rebuilds a formatted executive dashboard, including linked offline revenue. |
Architecture
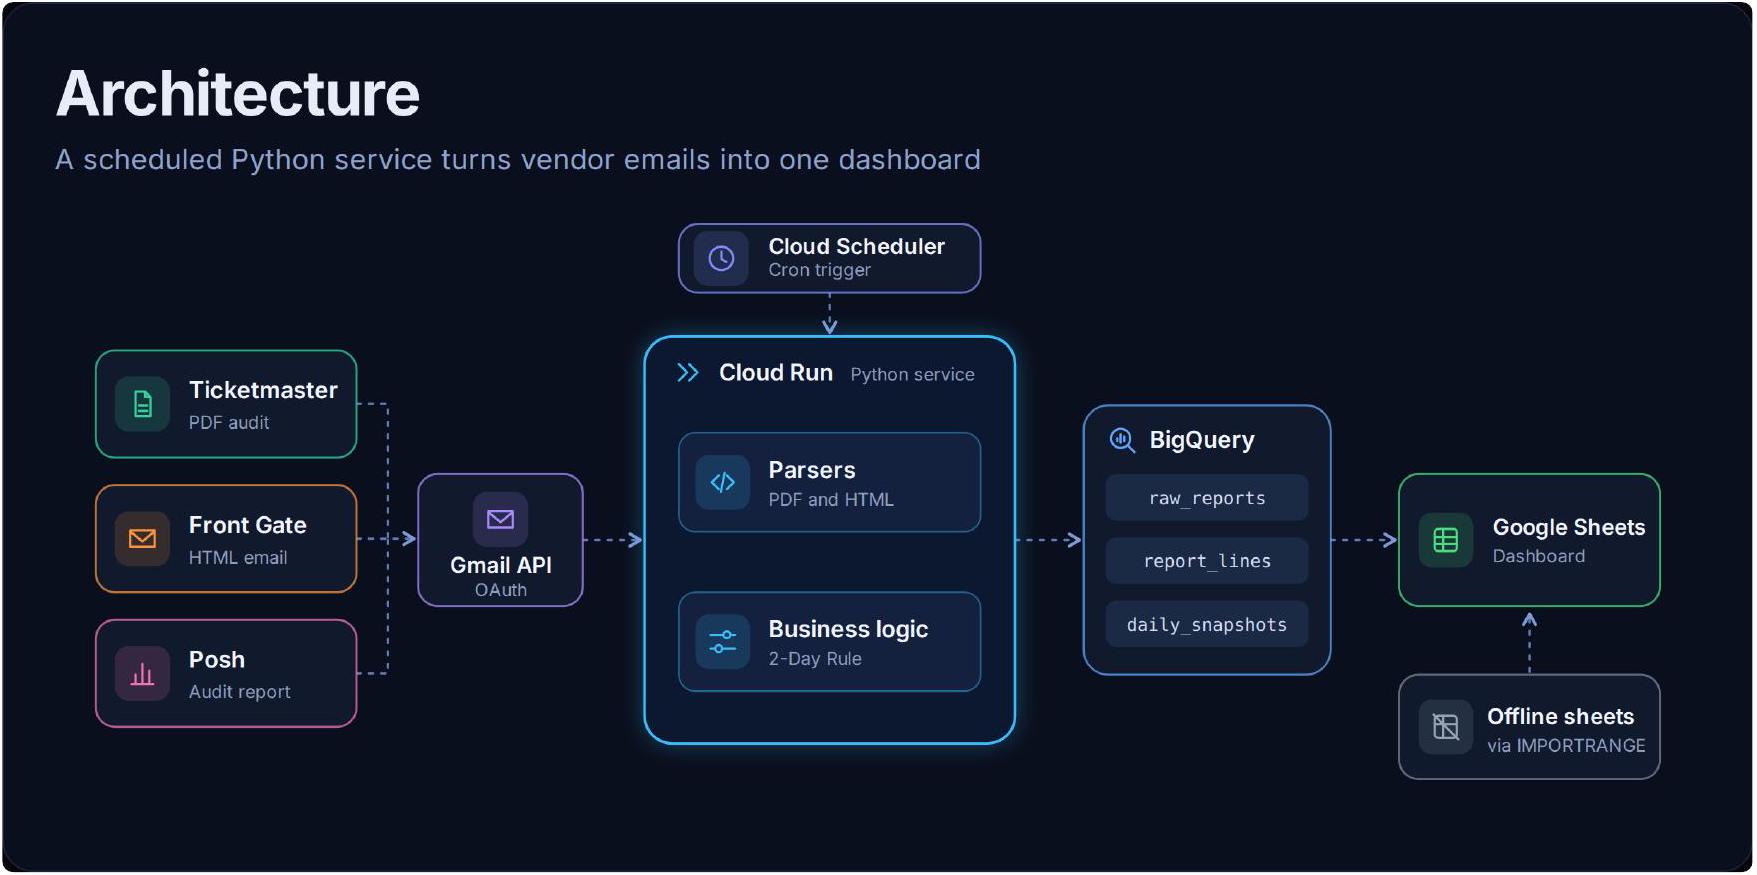
Offline VIP and sponsorship sheets are linked into the dashboard with IMPORTRANGE.
Core Pipeline Components
The pipeline is custom Python code split into four parts, each with one job.
Automated ingestion and parsing
The Gmail API with secure OAuth intercepts the daily audit emails from each vendor. Bespoke parsing engines handle the unstructured formats:
- Ticketmaster: a custom PDF scraper that bypasses AWS API Gateway redirects, reads complex tabular data and adjusts to unannounced layout changes by the vendor.
- Front Gate Tickets: an HTML parser that extracts inline tables directly from the email body.
Business logic
The code applies the client’s own rules instead of only moving data:
- The 2-Day Rule: splits a multi-day pass into the correct daily attendance buckets, for example one 2-Day Pass counts toward both Friday and Saturday.
- Wrap rates: computes 24-hour sales velocity.
- Dynamic capacities: detects and adjusts venue capacity limits from live vendor reports, so no hardcoded limit goes out of date.
Data warehouse
All parsed data goes into Google BigQuery to keep full fidelity and prevent double-counting. Three tables hold the history of every ticket sold:
| Table | Purpose |
|---|---|
| raw_reports | The original report as received from each vendor. |
| report_lines | The individual lines parsed out of each report. |
| daily_snapshots | The calculated daily position used by the dashboard. |
Dynamic dashboard rendering
The final step renders an executive-ready Google Sheets dashboard. The code formats the layout, freezes rows, color-codes stale data feeds and calculates multi-day averages.
A #MANUAL configuration area lets non-technical team members link external spreadsheets with =IMPORTRANGE() for offline VIP Table and Sponsorship revenue. The dashboard syncs this data automatically, so total top-line revenue appears in one view.
Product Experience
The executive team sees one Google Sheets dashboard that is rebuilt automatically from the BigQuery data. It formats itself, freezes the header rows, color-codes feeds that have not updated and shows multi-day averages, daily wrap rates and remaining capacity per show.
Results & Impact
The daily reporting cycle went from hours of manual transcription to no manual steps. The report gives no counts of events, hours saved or revenue, so none are stated here.
| Area | Result |
|---|---|
| Manual data entry | None. The pipeline runs on Google Cloud Scheduler. |
| Data accuracy | Transcription errors and arithmetic mistakes removed. The dashboard is the single source of truth for executives. |
| Revenue view | Online ticket sales and offline VIP and sponsorship revenue in one top-line view. |
| Onboarding new shows | A standard New Show Onboarding Template lets the client add a festival or ticketing platform in minutes. |
| Decision support | Real-time capacity and daily wrap rates inform ad spend and tier pricing. |
Technical Challenges & Solutions
Unstructured vendor formats
Challenge
Ticketmaster sends static PDFs behind AWS API Gateway redirects, and Front Gate sends tables inside email bodies.
Solution
A custom PDF scraper that follows the redirects and adapts to layout changes, plus an HTML parser for inline tables.
Outcome
Both vendors feed the pipeline without manual downloads.
Business rules that were done in the operator’s head
Challenge
A 2-Day Pass had to be split across Friday and Saturday by hand.
Solution
The 2-Day Rule, wrap rates and capacity detection are coded into the pipeline.
Outcome
Consistent daily buckets with no mental math.
Outdated hardcoded limits
Challenge
Venue capacities change, and fixed numbers in code go stale.
Solution
Capacities are read from live vendor reports.
Outcome
The dashboard shows current remaining capacity.
Double-counting and audit trail
Challenge
Daily reports overlap, so repeated loads could count a ticket twice.
Solution
A three-table BigQuery design (raw_reports, report_lines, daily_snapshots) keeps the original data and the calculated snapshots separate.
Outcome
A historical record of every ticket sold.
Offline revenue in separate sheets
Challenge
VIP Tables and Sponsorships were tracked outside the main sheet and maintained by non-technical staff.
Solution
A #MANUAL configuration area where staff link external sheets with =IMPORTRANGE().
Outcome
Offline revenue appears in the dashboard without code changes.
Key Takeaways & Future Development
Key takeaways
- End-to-end automation: email ingestion, parsing, calculation, storage and reporting run without human input.
- Custom code where vendors give no API: parsing PDFs and email tables made the data reachable.
- Built for scale: a decoupled design and an onboarding template let the client add shows and platforms quickly.
Future development
- Add parsers for further ticketing platforms as the client adds vendors.
- Add alerts when a vendor email is missing or a report layout changes.
- Extend the dashboard with ad-spend data to compare against sales velocity.