Power BI: Turning Five Booking Systems Into One Revenue Engine
A governed Power BI model and two dashboards that replaced three days of manual owner-statement assembly with an automated daily refresh for a short-term rental portfolio.
 Power BI
- Power BI
Power BI Case Study
BnB Heaven: short-term rental & boutique B&B management · 6-week engagement
BnB Heaven manages a portfolio of short-term rentals and boutique B&Bs across the UK. Bookings arrived from Airbnb, Booking.com, Vrbo and their own direct site; cleaning and turnovers lived in the ops tool; finance sat in the accounting system. Owner statements and the monthly board pack took three days to assemble by hand. This case study shows how we consolidated everything into one governed Power BI model with two dashboards, cutting reporting effort by roughly 90% and giving the team occupancy, rate and channel-profitability numbers they finally trust.
The Challenge
Before the project, 'how are we doing?' was a surprisingly hard question to answer. Three problems came up in every conversation with the team.
- Bookings scattered across platforms: Revenue lived in Airbnb, Booking.com, Vrbo and the direct site, with turnovers in the PMS and money in accounting. Nobody could see occupancy, nightly rate and net revenue in one place without exporting several files first.
- Owner statements ate three days a month: A manager rebuilt every owner statement and the board pack by hand (copy, paste, reconcile, repeat). By the time they were ready the numbers were weeks old, and one slip meant redoing the lot.
- No shared version of the truth: Channel profitability after platform fees was invisible. It wasn’t clear which channels actually paid off once commissions were taken out, so pricing and listing decisions were made on gut feel.
The Approach
Rather than bolt a chart onto each platform, we built one properly modelled layer underneath a small number of focused dashboards. Four phases over six weeks:
- Discovery & metric definitions (week 1): Workshops to agree exactly what occupancy, ADR, RevPAR and net-of-fees revenue mean (one signed-off definition each, so the model has a single source of truth).
- Connect & clean with Power Query (weeks 2–3): ETL into all five sources, standardised property and channel keys, and consistent handling of platform fees, refunds and cancellations so figures reconcile to the accounts.
- Star-schema model & DAX (weeks 3–4): A clean fact-and-dimension model with a shared date table, reusable DAX measures (occupancy, ADR, RevPAR, YoY, target) and row-level security so each owner sees only their own properties.
- Dashboards, refresh & handover (weeks 5–6): Two role-based dashboards, an on-premises gateway for the automated 06:00 refresh, plus training and a short written guide so the team can extend the model themselves.
The Solution
Executive overview
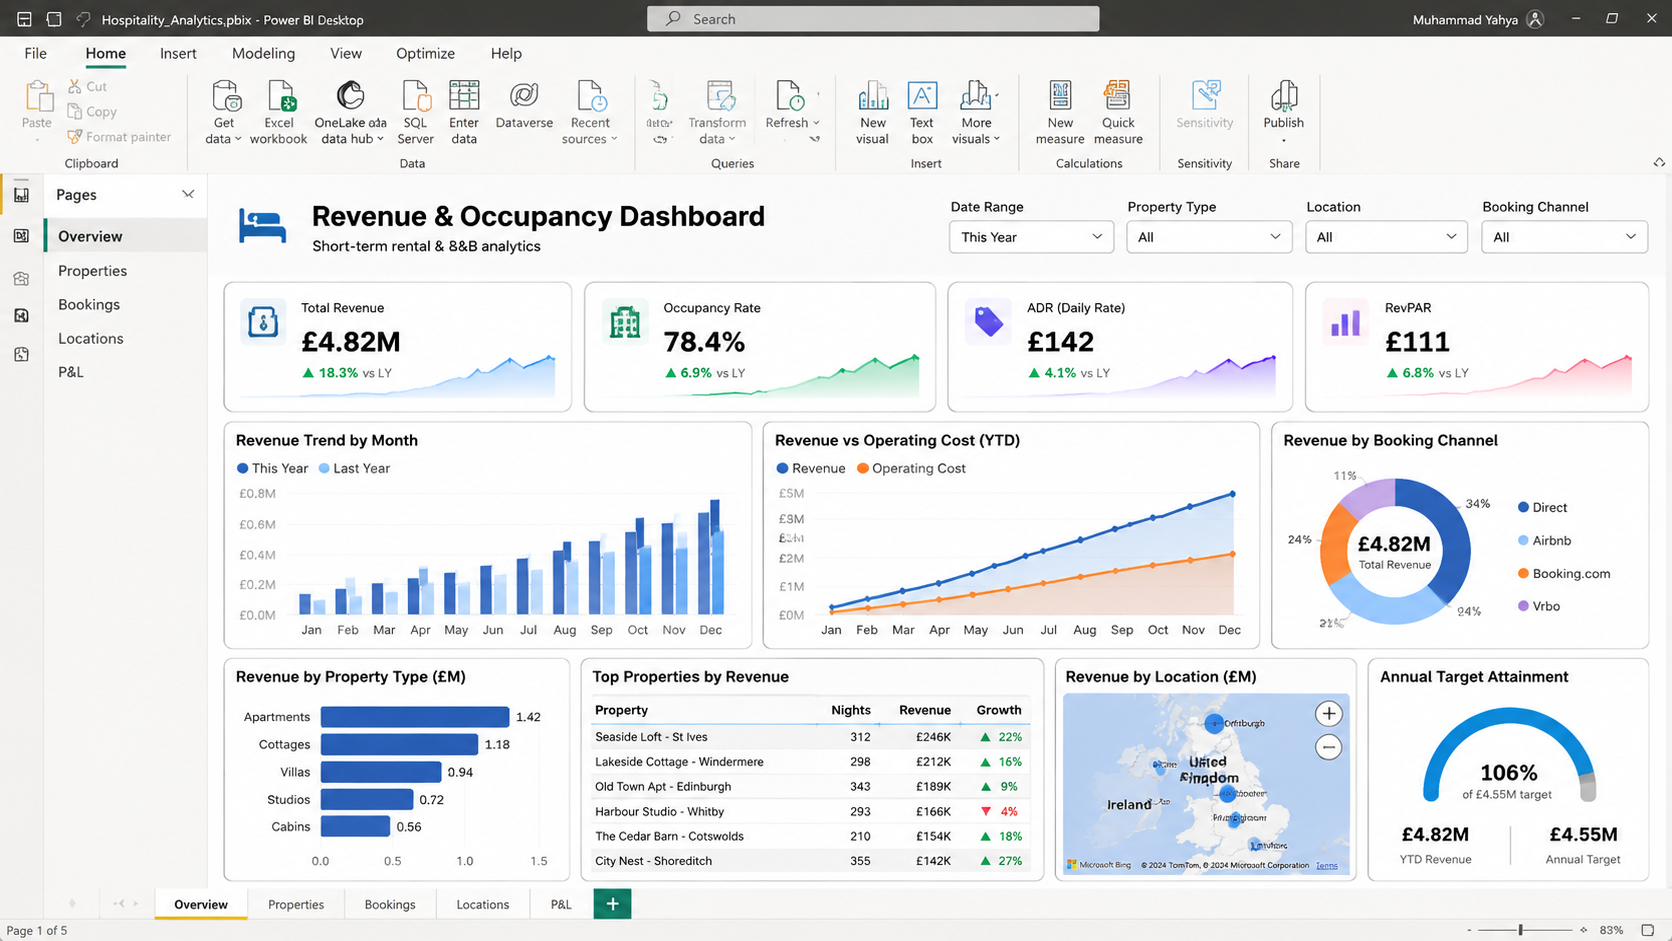
The board-level view answers leadership’s core questions on one screen: where revenue comes from, how occupancy and rate are trending, which properties and channels pull their weight, and whether the year is on target.
Operations & guests
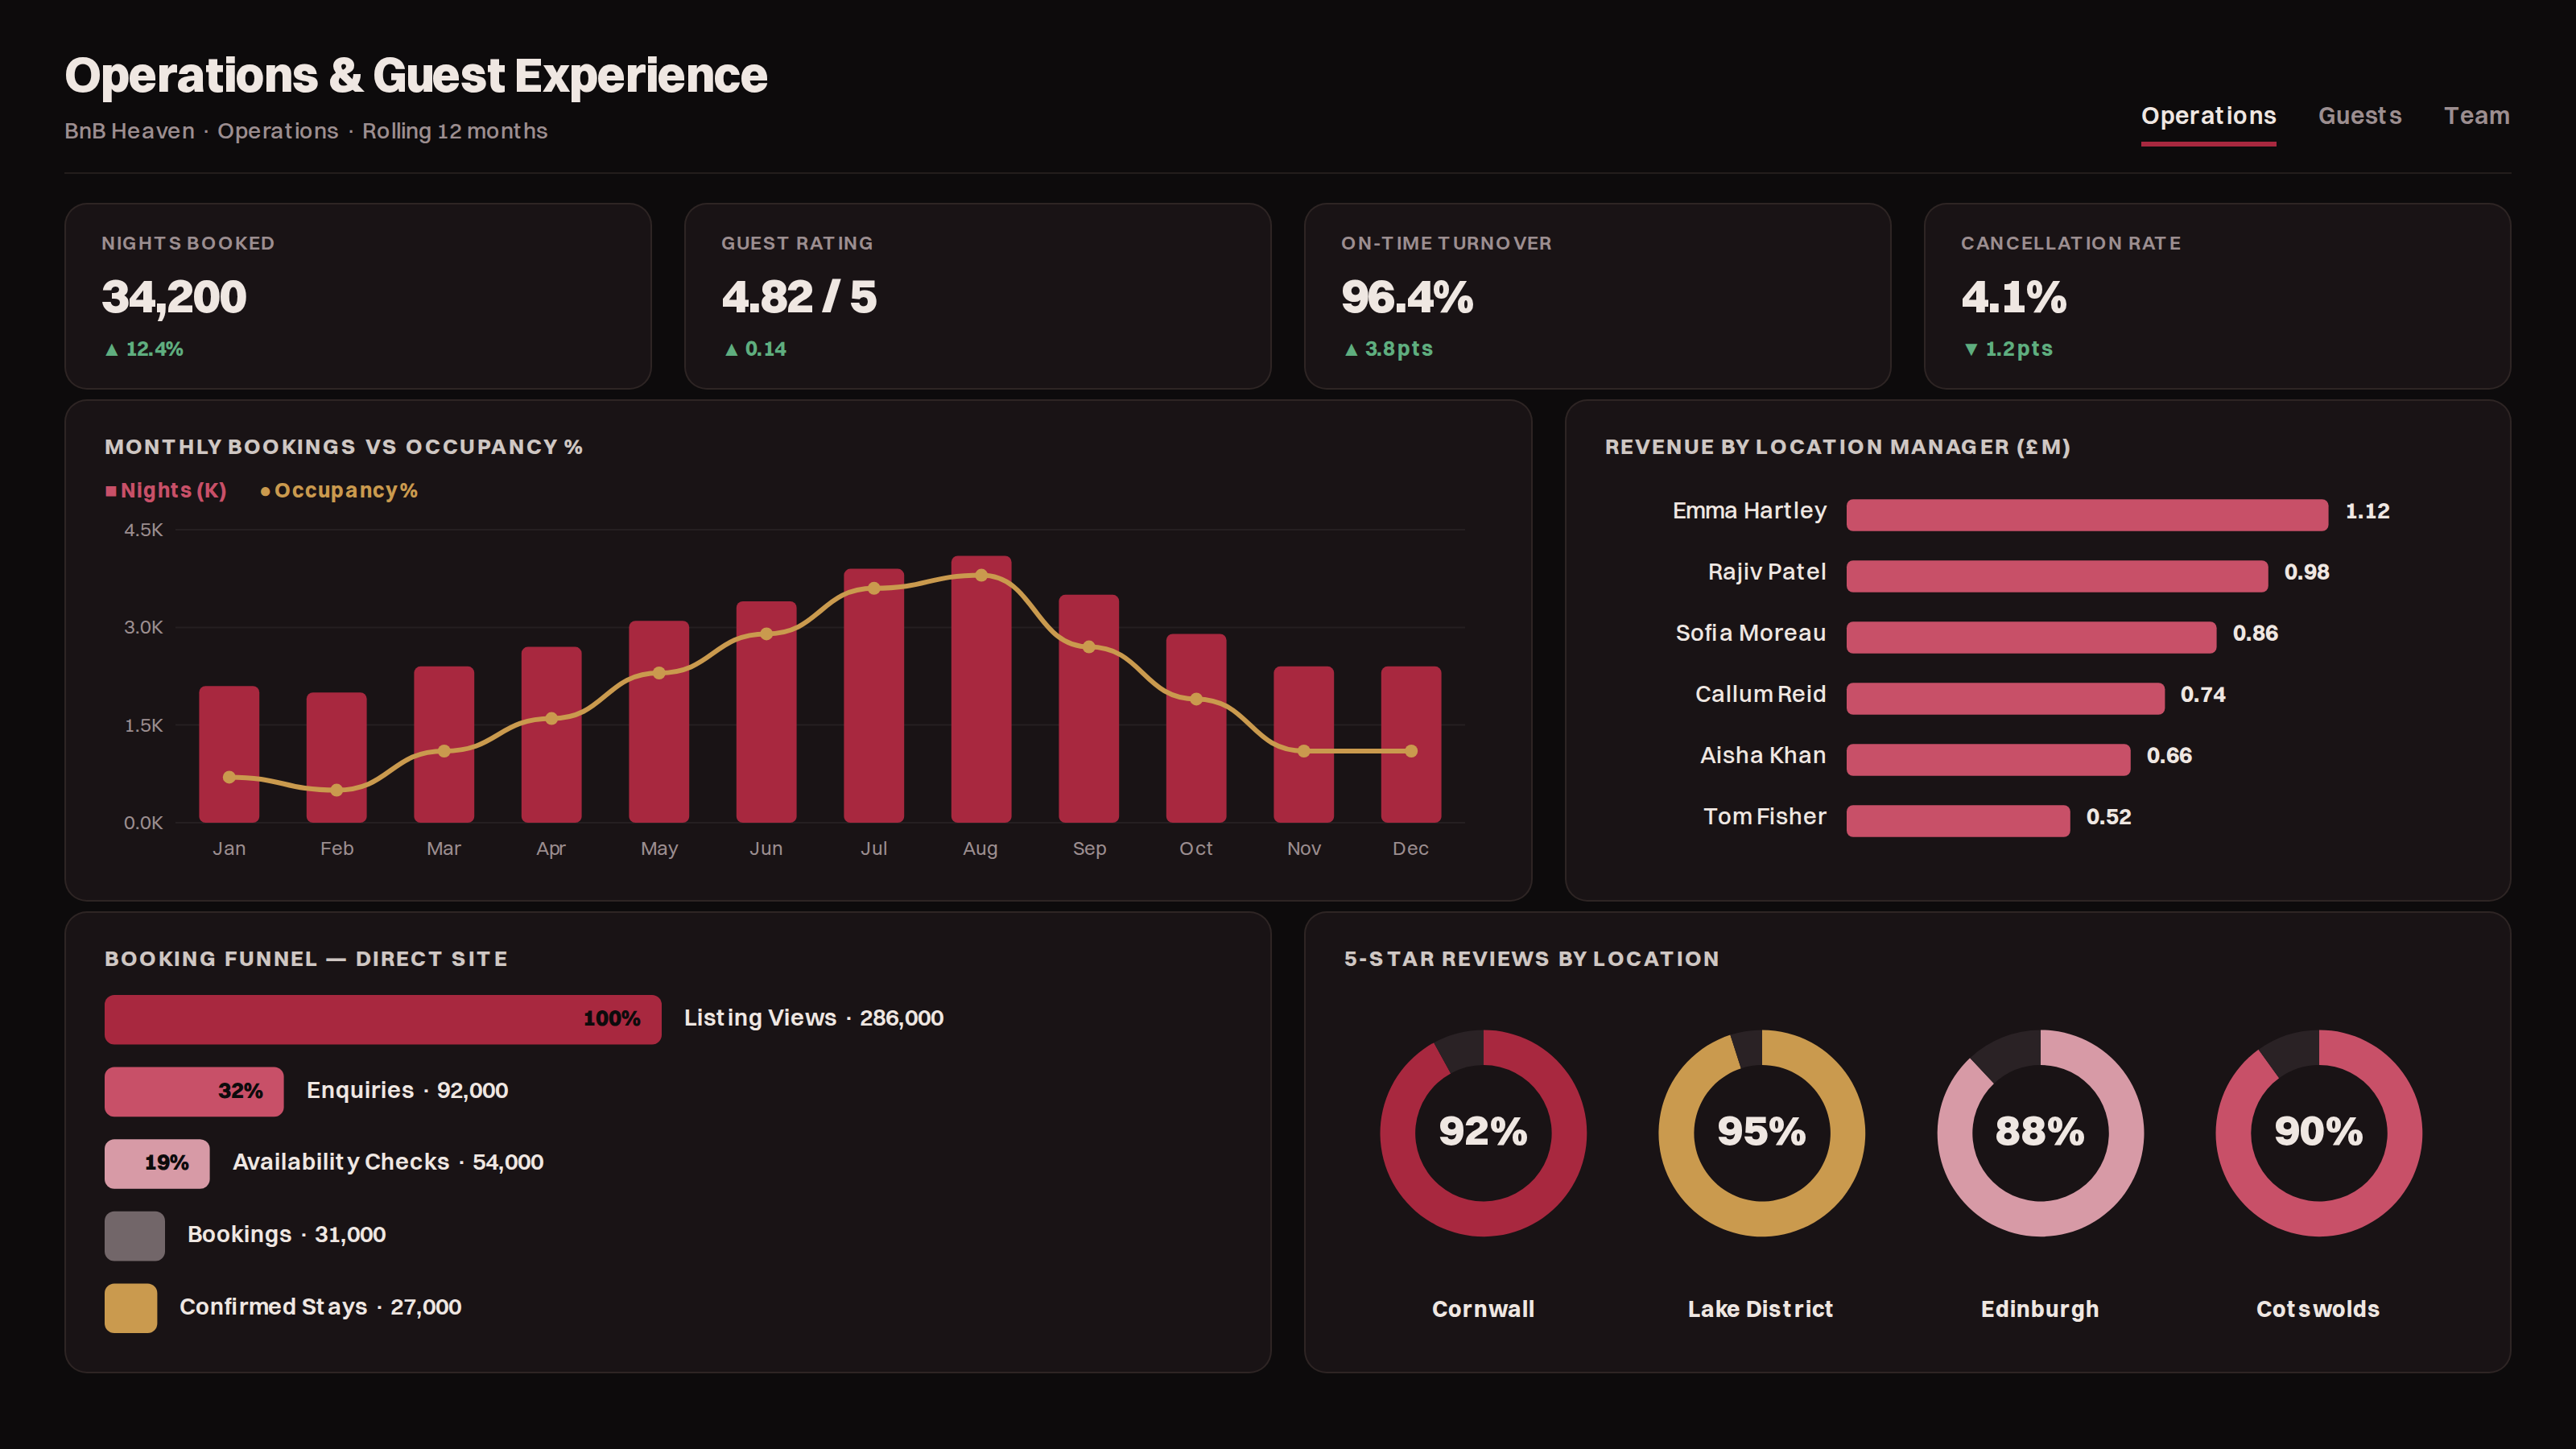
The operations view is a daily working screen for the wider team: booking volume against occupancy, manager contribution, the direct-site booking funnel and guest satisfaction by location.
- Cumulative revenue vs operating cost shows the margin gap at a glance.
- Channel donut exposes reliance on commission-heavy platforms vs direct.
- Top-property table ranks by revenue with live YoY growth flags.
- Gauge tracks progress against the £4.55M annual target (106%).
Under the Hood
| Layer | What We Built | Tools |
|---|---|---|
| Sources | Airbnb, Booking.com, Vrbo, direct site, PMS / channel manager, accounting | REST / API / file connectors |
| Ingest & clean | Dedupe, key standardisation, fee / refund / cancellation handling | Power Query (M) |
| Model | Star schema, shared date table, reusable measures | Power BI model + DAX |
| Governance | Row-level security by owner / manager, documented definitions | RLS roles |
| Delivery | Two role-based dashboards, automated daily refresh | Power BI Service + gateway |
The Results
| Measure | Before | After |
|---|---|---|
| Owner statements & board pack | ~3 days, manual | Automatic, ready by 06:00 |
| Data freshness | ~3 weeks old | Refreshed daily |
| Channel profit (net of fees) | Invisible | Live, per channel |
| Sources reconciled | Manually, error-prone | Reconciled to accounts automatically |
With channel profitability visible net of platform fees, BnB Heaven leaned into direct bookings and trimmed commission-heavy inventory, finishing the year 6% ahead of target.